Getting nerd-sniped into scraping my train's API
Table of Contents
- My high-speed train has a dashboard?
- Nice dashboard, what's this?
- How do you get your data?
- Scraping the data and storing it
- InfluxDB my beloved
- Name a better duo than these two
- The real trip was the dashboard we made along the way
While checking if the train's onboard internet system had improved, I discovered an nice web-based dashboard showing my trip on a map fed with accurate real-time data. One thing led to another, and I was knee-deep in the Socket.IO documentation, scraping the train's onboard API for fun (and visualization).
My high-speed train has a dashboard?
Near the end of December last year, I boarded a French TGV ("Train Grande Vitesse", literally "High Speed Train") to go from Bordeaux, southwest of France, towards the northeast of the country. These trains have on-board Wi-Fi, which is not known to be particularly great, but hey, what can you expect from a train cruising at 320 km/h in the middle of nowhere?
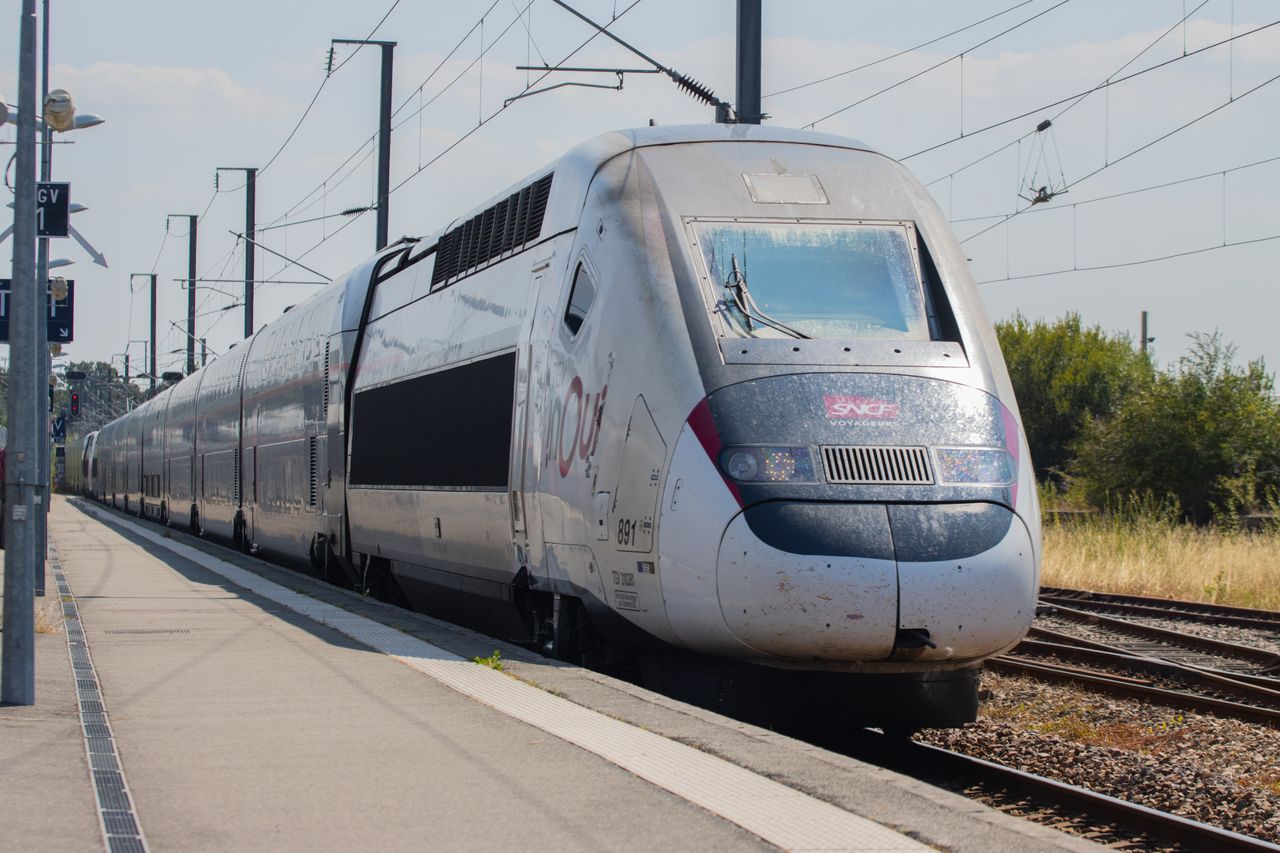
Well apparently, it was still possible to offer a better service, as I learned from a discussion with someone working at SNCF (the French national railway company). This person also told me how to know if my train carriage had the new LTE system installed, which in theory would offer way better coverage and service, even in the countryside.
Turns out my train was indeed equipped with this new system. My curiosity piqued, I connected to the onboard Wi-Fi system to see if it was an improvement over the previous system. I had at least 6 hours to kill anyway. Once connected, I was greeted with a captive portal telling me to accept the usual paperwork and to sell my soul to Palantir (/s), then it redirected me to the usual on-board information page with a few tabs such as "entertainment" for watching movies, "Le Bistro" for seeing what's available at the on-board bar, and a tab named "My Journey".
Nice dashboard, what's this?
The "My Journey" tab was a nice and simple dashboard presenting real-time information about the travel, such as next stops, the train on a map, and a speed widget in the bottom right corner, all updated in real time as the train was gliding along the tracks.
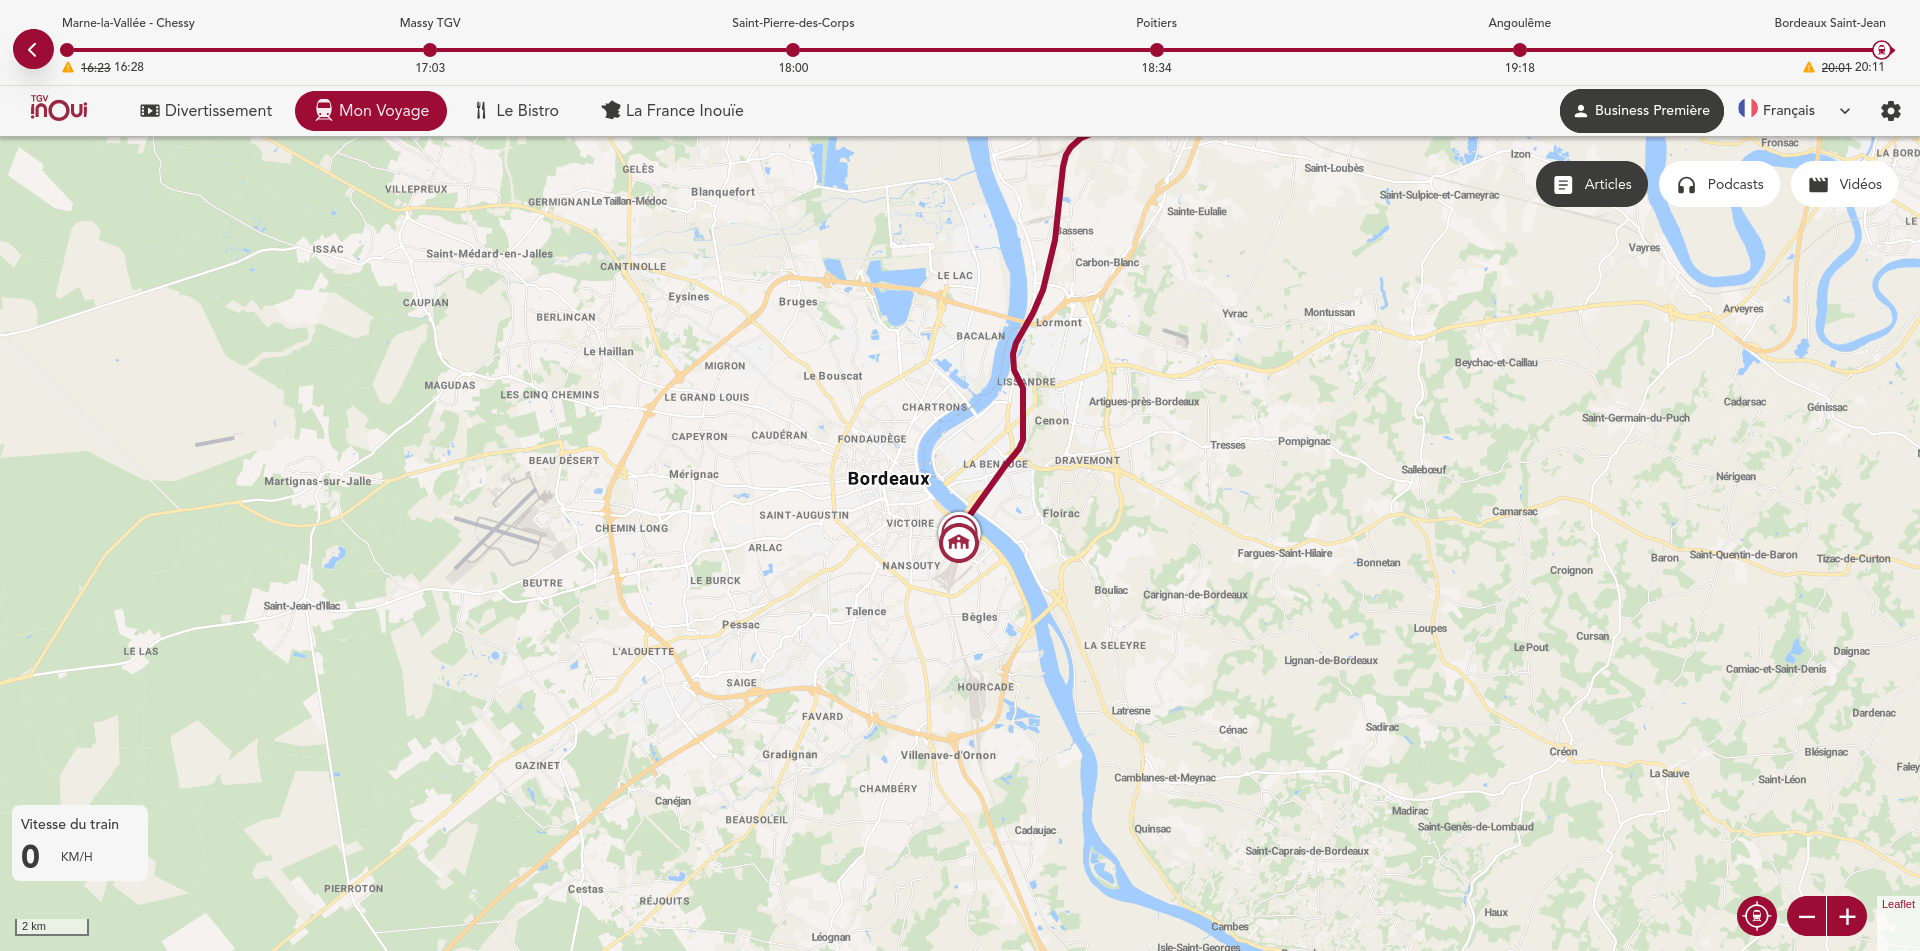
As I was contemplating this dashboard, I wondered: this data seems relatively up-to-date, with the speedometer closely matching our accelerations and our decelerations, how does this dashboard get this data, and wouldn't it be nice to record it to keep for later, as a flight recorder would do? And if this data is updated on the dashboard, there should be a way for me to scrape it in a somewhat clean way, right?
The dashboard is updated in real time, but how?
Sometimes, a webpage needs to automatically update the data it's showing to the user, without said user having to click on anything. You could see that kind of behavior on a Cloud Provider dashboard, where resource status and availability is updated in real-time, or on a food delivery page for showing the order status.
As with a most things tech-related, there are tons of ways to achieve the data-retrieval part, but it can be boiled down to a "push vs. pull" approach from the server point of view, as the server is the one needing to update the client's data. Moreover, as the clients usually sit behind a firewall or share IP addresses, servers can't easily send data unsolicited, so the initial requests have to come from the clients themselves.
Following this principle, the "push" approach generally utilizes WebSockets, which is a kind of long-lived two-way connection: the client initiates the connection, which then stays open with both the server and the client being able to send data through a kind of tunnel to each other. This technology has the advantage of being lightweight and allowing the server to send data only when necessary. This is what Ruby on Rails uses under the hood with Action Cable for building real-time features.
The "pull" approach, on the other hand, uses more conventional single-use requests, regularly asking the server if anything has changed. This process is more commonly called "polling", and is the tech equivalent to a kid in the back of a car constantly asking "are we there yet?". This system consumes more bandwidth and processing power for both the client and the server, but has the advantage of being more compatible as it relies on the most basic feature a web browser has: making requests.
How do you get your data?
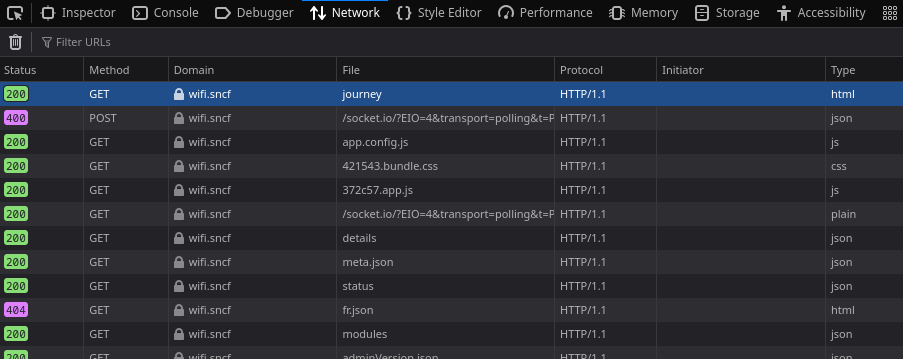
Knowing waht I expected to find in the dashboard's network requests (either a long-lived WebSocket request or a ton of similar requests), I opened my browser's inspect view. At first, I didn't see anything particularly interesting, just a bunch of classic assets (JS, CSS, etc.) being requested, nothing screaming like "I'm what's responsible for updating the dashboard every second".
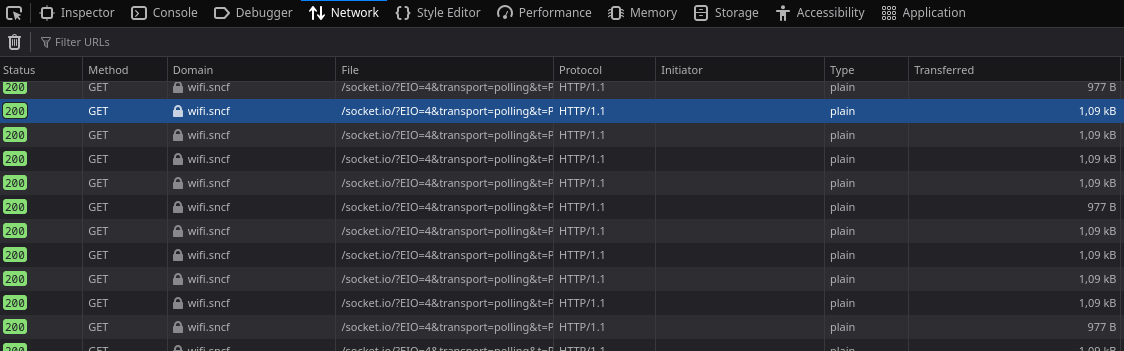
Then, after scrolling a bit, I saw it. A simple GET request, made every second,
to a URL always looking like https://wifi.sncf/socket.io/?EIO=4&transport=polling&t=[REDACTED]&sid=[REDACTED].
Okay, so it seemed to me like these requests were responsible for getting new data to update the dashboard, so I started taking a look at the response data:
42/router/api/pepita,["gps",{"success":true,"fix":9,"timestamp":1766234412,"latitude":48.9504782,"longitude":5.603243,"altitude":276.759,"speed":87.003,"heading":91.5386}]The number 42, followed by what seemed like a web path to a pepita endpoint,
and a JSON array containing what seemed to be GPS data, including coordinates
and speed. Perfect, this data seemed to match what the dashboard was presenting
so I had the first piece of the puzzle!
While I inspected theses requests, I found some other that queried the same URL but got a different kind of data that wasn't shown anywhere on the dashboard, such as a number named "connected devices". Interesting...
42/router/api/pepita,["connected_devices",{"devices":81}]All requests seem to be sent to a socket.io endpoint, which rang a bell.
A quick web search later, I was knee-deep in the How it works
page from the Socket.IO documentation.
Socket.IO
Upon reading the Socket.IO documentation, a few concepts felt relevant to the requests I was seeing in my browser.
First, I learned that Socket.IO uses a component named Engine.IO for "establishing
the low-level communication between the server and the client". In the requests,
this sounds related to the EIO=4 parameter, where 4 would be a version number.
Then, the documentation explains that there are multiple transport methods, such
as WebSocket and polling. This also would explain the transport=polling argument
and the fact that the client is sending requests every second to get server updates.
While digging a bit more, I also found the Client API docs,
which confirmed the supposition I made for both parameters, and also told me that
the sid parameter was the session ID and that the t parameter was a hashed
timestamp used as a cache-busting system. I was definitely on the right path, so
I continued reading.
In the Exchange protocol documentation page, I also learned how to decode a request like the following one:
42/router/api/pepita,["connected_devices",{"devices":81}]4: Engine.IO packet type "message"2: Socket.IO packet type "event", used for sending data/router/api/pepita: namespace["connected_devices",{"devices":81}]: actual payload for topics
Now that I knew how the dashboard was getting a stream of fresh data, it was time for me to do the same.
Scraping the data and storing it
I envisioned this project as a two part system: first, I'd need to scrape the data from the train's on-board API, and then I'd need to store it in a database. Of course, I saw this as an opportunity to have some fun in Rust, which was quite fit for the job and which I already used for similar projects in the past.
As I wanted to save the most data possible and as my train was still gliding at 320 km/h, I had to spend as little time as I could on the coding part, while still making it stable enough so that it wouldn't crash at the slightest inconvenience, missing a bunch of data points at the same time.
My first requirement, other than the language itself, was that I wanted to utilize serde for deserializing the JSON payload returned from the API. This would allow me to keep my code clean and simple while using standard data structures which wouldn't limit the possibilities for reusing the extracted data.
After a bit of digging in the "Rust Socket.IO client implementations" bin, I stumbled upon rust-socketio. Although it hadn't been updated in a while, which wasn't really an obstacle as this project wouldn't be handling any private or sensitive data, it did everything I needed it to do. This crate supports logging in and staying connected while using a callback system for handling incoming data, which I usually prefer using in my projects as it helps me keep my code structured in a sane way without really thinking about it.
Connecting to the train's Socket.IO endpoint was fairly easy with this crate, especially after dissecting the data packets earlier:
let socket = ClientBuilder::new("https://wifi.sncf")
    .namespace("/router/api/pepita")
    .on("gps", gps::callback)
    .on("connected_devices", connected_devices::callback)
    .on("internet_link_quality", internet_link_quality::callback)
    .on("error", |err, _| {
        async move { eprintln!("Error: {:#?}", err) }.boxed()
    })
    .reconnect_on_disconnect(true)
    .connect()
    .await
    .expect("Connection failed");
The gps topic was the most important for me, as it described the train's
coordinates, speed, and altitude. The connected_devices topic periodically
reported a devices integer which supposedly followed the number of connected...
devices, yes, on the train's network. I thought that it could be useful to have
a rough estimate of the occupancy rate on board. As for the internet_link_quality,
although it was referenced in a bunch of similar projects to what I was trying to
achieve, I never got any data from the onboard API on this topic.
These topics' equivalents in Rust structs were as follows:
#[derive(Debug, Deserialize)]
struct InternetLinkQuality {
    quality: i64,
}

#[derive(Debug, Deserialize)]
struct ConnectedDevices {
    devices: i64,
}

#[derive(Debug, Deserialize)]
struct GpsData {
    fix: i64,
    latitude: f64,
    longitude: f64,
    altitude: f64,
    heading: f64,
    speed: f64,
    success: bool,
    #[serde(rename = "timestamp", with = "ts_seconds")]
    time: DateTime<Utc>,
}
The only transformation done here is to turn the GPS' timestamp field, returned
in seconds by the API, into a proper DateTime object using serde's built-in
ts_seconds
method.
As for a callback example for processing the actual payload, the gps one could
be written as follows:
pub fn callback(
    payload: Payload,
    _client: asynchronous::Client,
) -> Pin<Box<dyn Future<Output = ()> + Send>> {
    async move {
        match payload {
            Payload::Text(value) => {
                if value.is_empty() {
                    unreachable!("GPS data is empty.")
                }

                let data: GpsData = serde_json::from_value(value.first().unwrap().to_owned())
                    .expect("Could not deserialize to GpsData object.");
                println!("{}", data);
                if data.fix.is_negative() {
                    println!("Ignoring GpsData as fix is negative.");
                } else {
                    // Do something with the data
                }
            }
            _ => unreachable!("Got something else than text for GPS data."),
        }
    }
    .boxed()
}
Please keep in mind that this code is NOT perfect and has been written in a quick-and-dirty way. Yes, I'm talking about the raw
.first().unwrap()here. If the API is drunk and returns the wrong data structure, this code explodes.
The special data.fix.is_negative() case was added because when the train
momentarily lost its GPS connection (#tunnels), the fix integer would be set
to -1 and the data would be unusable:
📡 Long. 0 Lat. 0 Alt. 0 - Heading 0 - Speed 0 - Fix: -1 - Time +57961-11-30 20:43:22 UTC - ✅Printing this continuous stream of fresh data in a terminal was pretty satisfying to watch, but it was only half of what I expected this program to do: I still had to tackle the "store it for later use" part of the project.
InfluxDB my beloved
As this data is describing the evolution of a bunch of fields on a time axis, I thought that it would be a great fit to use a time-series database engine for storing it and using efficiently. A few well-known free and open-source options exist, such as TimescaleDB, Prometheus and InfluxDB.
As I only wanted to store time-series data, having a full-blown relational system available felt like a waste of time and resources, so TimescaleDB was out of the picture. Prometheus could have been a good fit, but the pull approach wasn't really what I envisioned, especially given how often I was receiving data. I just wanted to use a purpose-built time-series database to which I could just push data, and InfluxDB was perfect for this use case.
Moreover, I was already familiar with pushing data to InfluxDB using Rust as I had already written a similar connector for scraping my ISP router's API for fun.
As I still wanted this project to be done as soon as I could, I used the influxdb
crate. This crate also had a derive feature available for serializing Rust
structs straight into queries that the database could understand, meaning that
I didn't have to write a translation layer between my code and what the crate
expected to be fed, keeping the code clean and minimal.
With this crate imported, the code needed to send the previously collected GPS
data to an InfluxDB bucket (the equivalent of a database), I only had to add
the InfluxDbWriteable trait to my GpsData structure, and write the actual
logic to push said data from the callback code to the bucket, as follows:
let influxdb_config = InfluxDBConfig::default();
let client = Client::new(influxdb_config.url, influxdb_config.bucket)
    .with_token(influxdb_config.token);
client
    .query(data.into_query("gps"))
    .await
    .expect("Could not write GPS data to InfluxDB.");
As you can see, the logic is very easy to follow. First, the InfluxDB "configuration"
(in reality, a structure holding all the arguments for authenticating with the
InfluxDB API) gets loaded, then passed to a client builder to get, well, an
InfluxDB client. Then, said client is invoked for writing the structure
de-serialized from the train's API into the gps measurement.
All fields are transmitted "as-is" to make sure that no information is lost before storage.
Okay, so now the API is scraped, the data is saved, and everyone lived happily ever after, right?

Name a better duo than these two
Of course not! Now that the data was stored, I wanted to present it in an interesting and interactive way, and although it is possible to visualize InfluxDB series data using the built-in web interface, there are better tools available. And one of these tools is a famous open-source web-based data visualization software that integrates very well with InfluxDB: Grafana!
Once the data source was configured in Grafana's settings, it was time to create a dashboard to show the train's journey with the data I had:
- GPS
- Coordinates (latitude, longitude, altitude, heading angle)
- Fix - number of satellites connected
- Speed - in meters per second
- Number of connected devices
First, I wanted to write a query in Flux (InfluxDB's querying language) to graph
the train's speed over time. For this, I needed to query the speed field from
the gps measurement, in a specific time range and with an interval that kept
some details while not dumping the whole bucket, and as the API returned it in
meters per second I multiplied it by 3.6 to convert it to kilometers per hour.
from(bucket: "sncf")
  |> range(start: v.timeRangeStart, stop: v.timeRangeStop)
  |> filter(fn: (r) => r["_measurement"] == "gps")
  |> filter(fn: (r) => r["_field"] == "speed")
  |> aggregateWindow(every: v.windowPeriod, fn: last, createEmpty: false)
  |> map(fn: (r) => ({ r with _value: r._value * 3.6 }))
Another one was for getting the GPS coordinates to plot the journey on a map.
As latitude, longitude and altitude are different fields, I used the pivot
function, as described here,
for "joining" these fields based on their time. I believe this could (and should)
be done in a cleaner way, but it was good enough for me in the moment. The final
query looks like this:
from(bucket: "sncf")
  |> range(start: v.timeRangeStart, stop: v.timeRangeStop)
  |> filter(fn: (r) => r["_measurement"] == "gps")
  |> filter(fn: (r) => r["_field"] == "latitude" or r["_field"] == "longitude" or r["_field"] == "altitude")
  |> aggregateWindow(every: v.windowPeriod, fn: last, createEmpty: false)
  |> pivot(rowKey: ["_time"], columnKey: ["_field"], valueColumn: "_value")
  |> yield(name: "last")
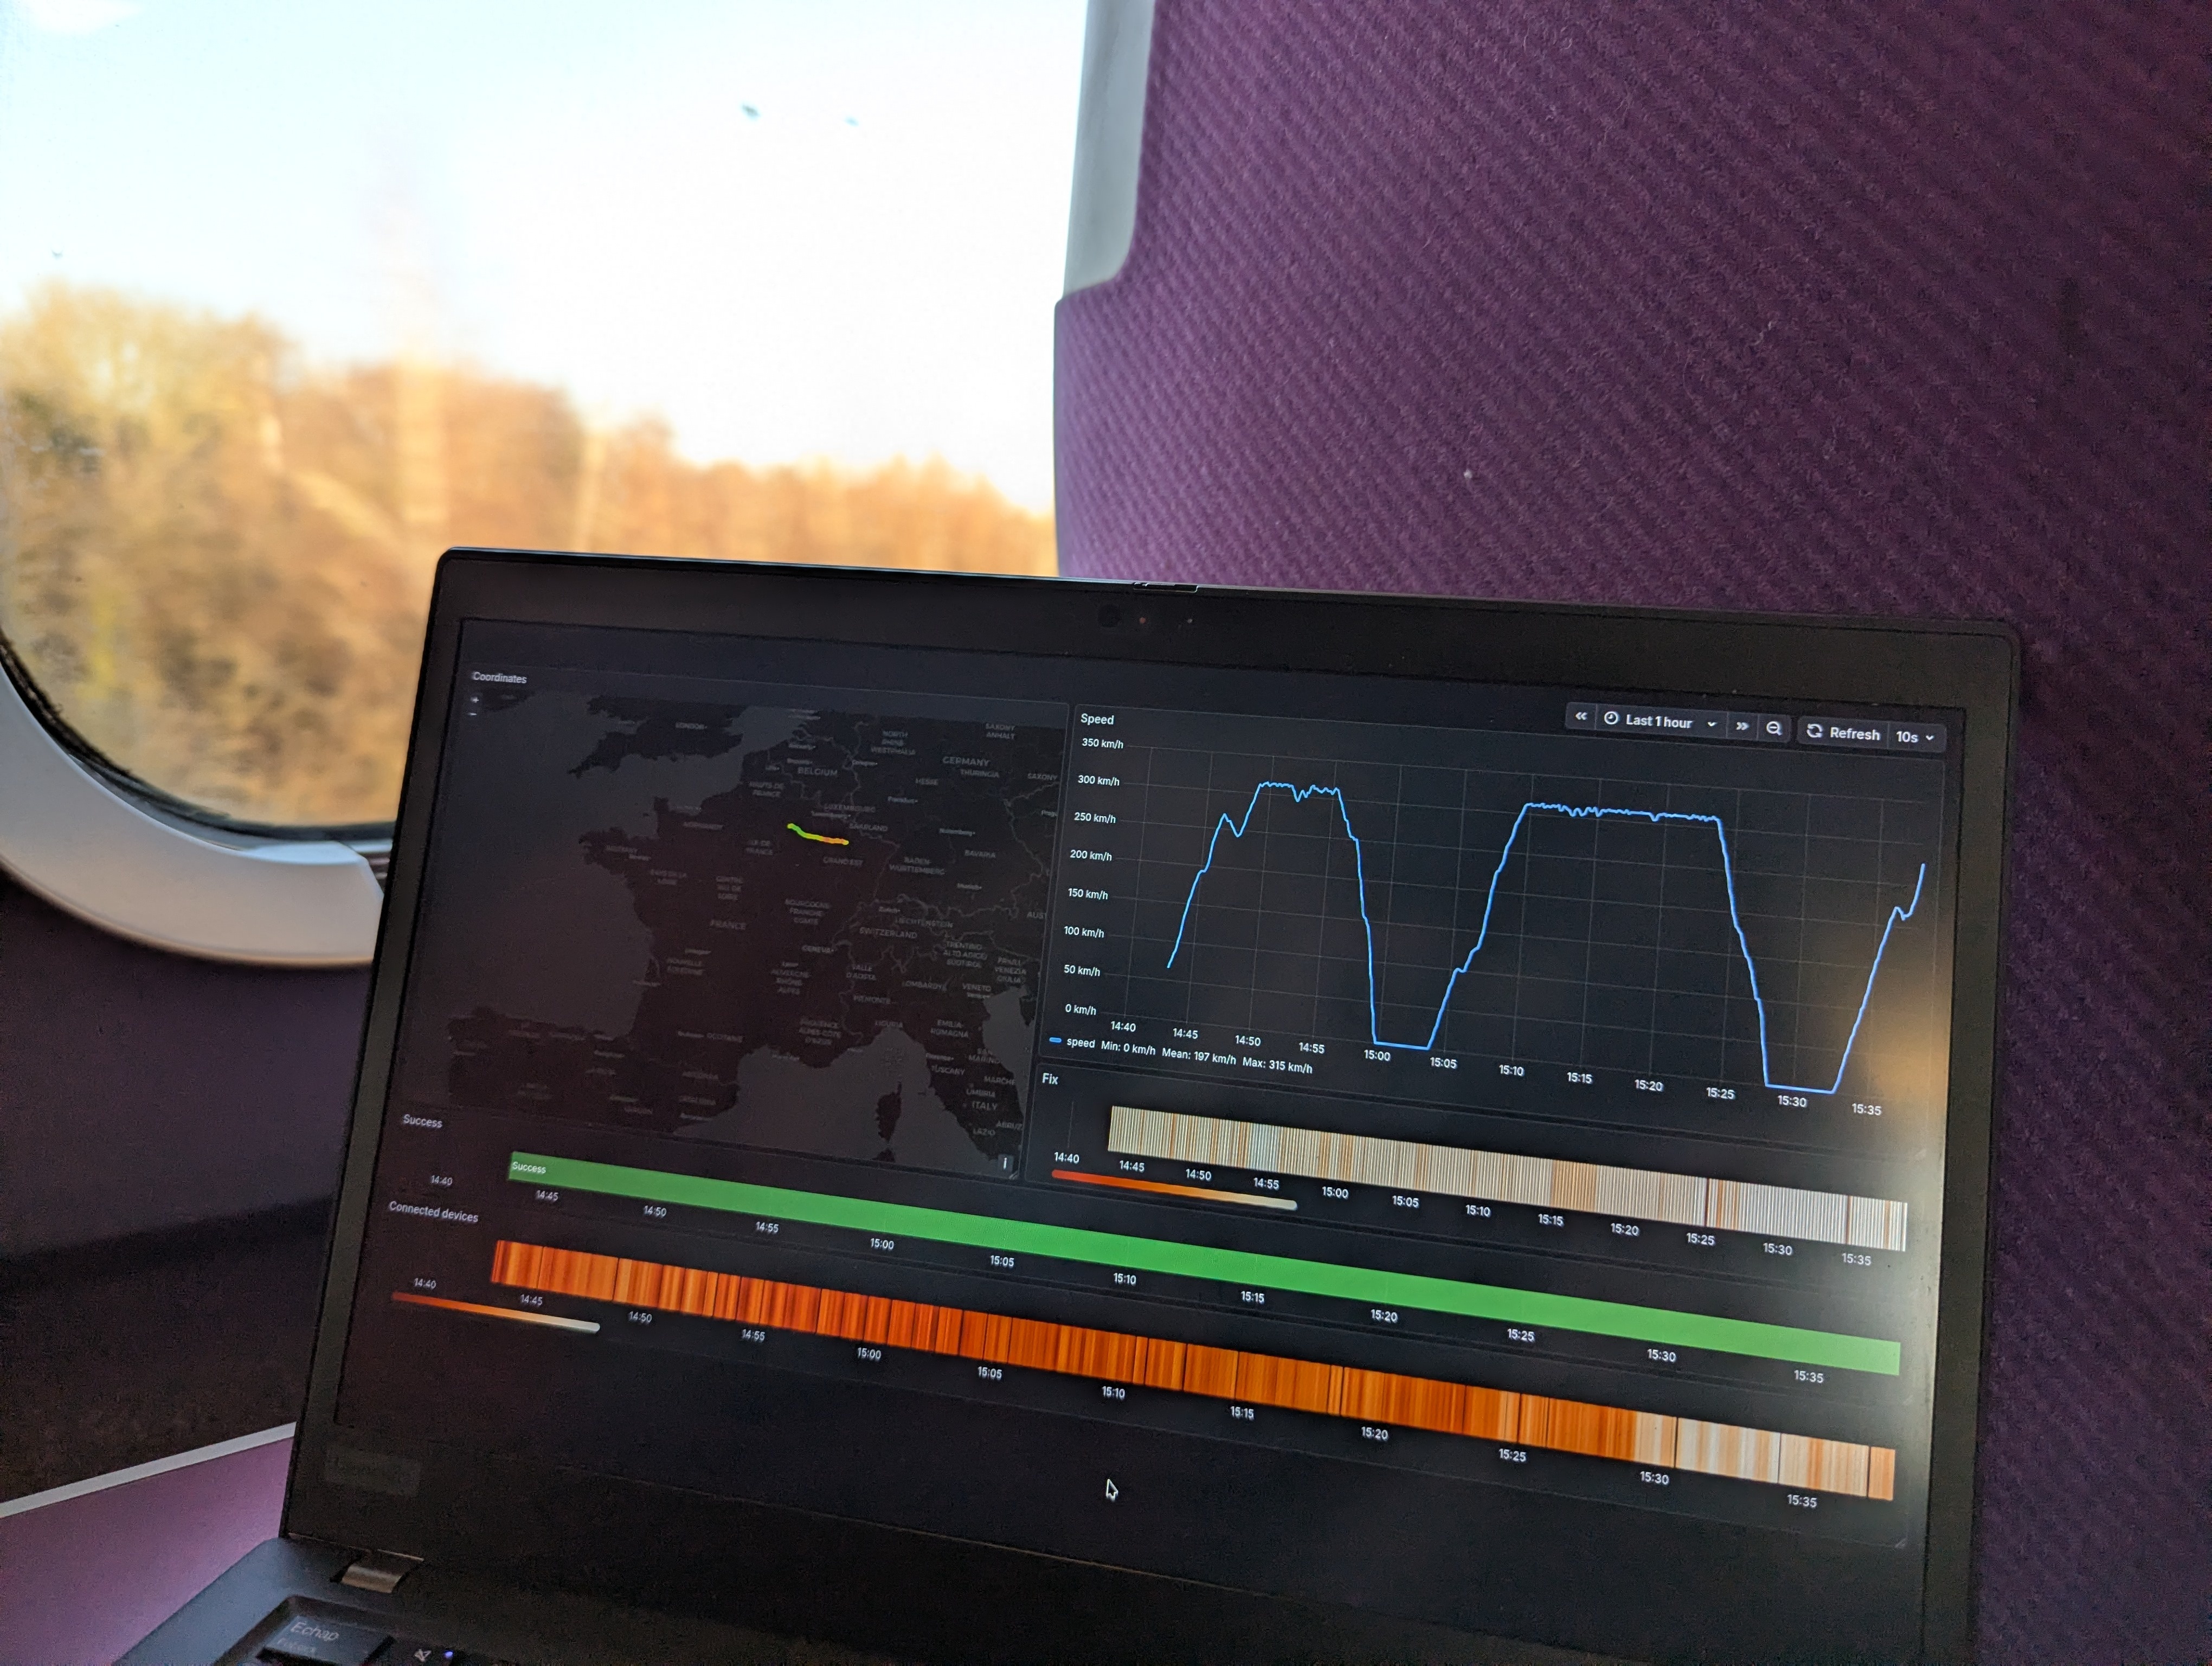
A few queries later, the dashboard was ready, and I just sat back and enjoyed the view for the rest of the journey.
At the end of the trip to come back to Bordeaux, the dashboard was pretty satisfying to see:
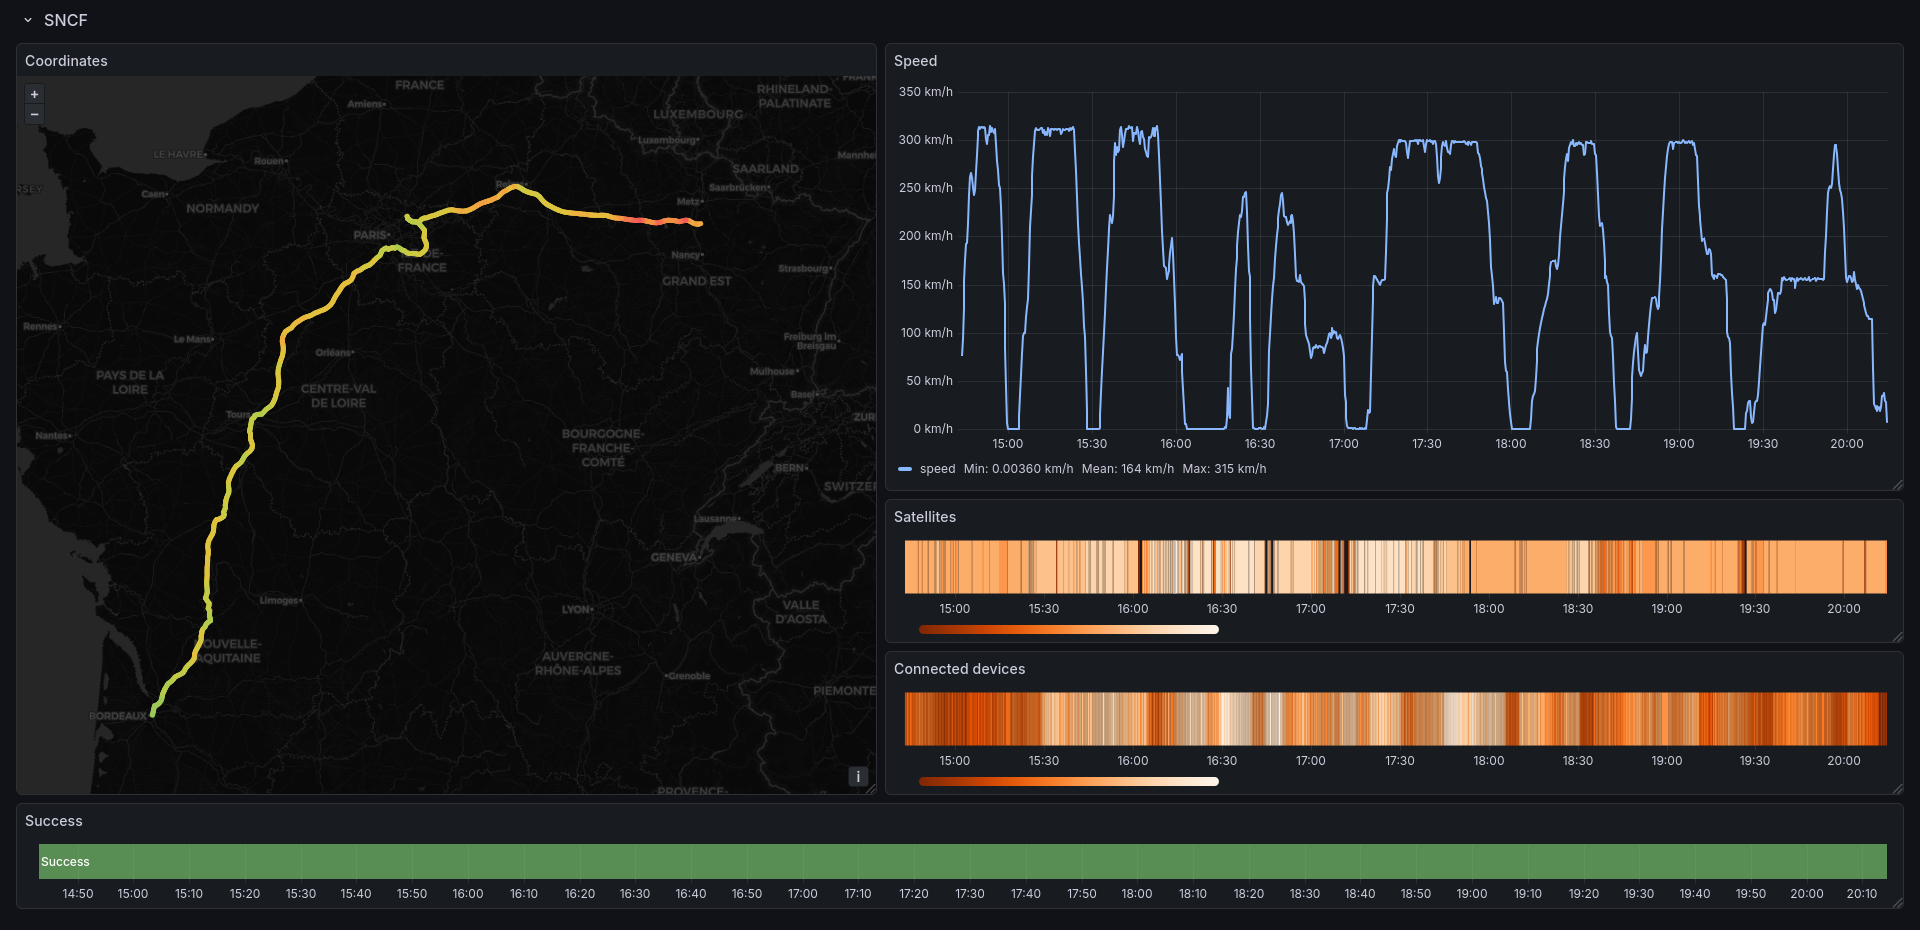
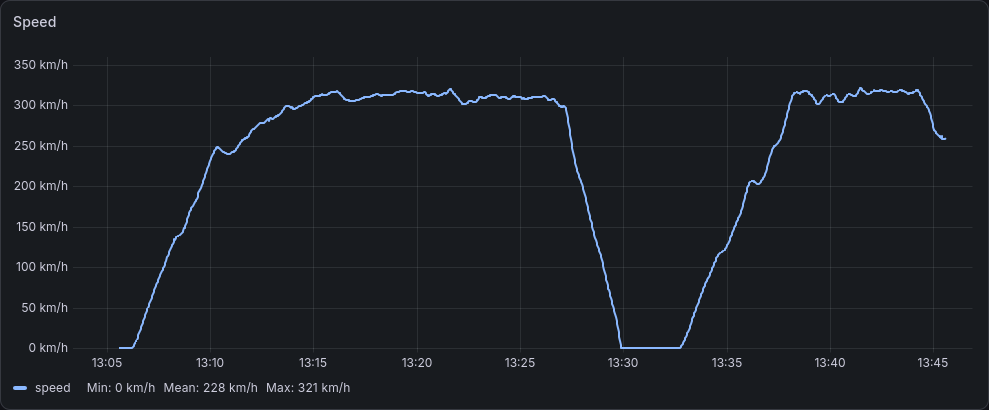
The max speed on my way back was around 315 km/h, but at the end of my first trip I was able to capture a top speed of 320 km/h:
The real trip was the dashboard we made along the way
I must admit, I completely got nerd-sniped on my way to check if the internet quality was indeed better with this new network system, but to answer my own question at the beginning of this post: yes, the internet connectivity on board was quite decent. It was comfortable enough that I never really felt the need to create a mobile hotspot, and it was sometimes even better than what my cell phone was receiving.
Although unexpected, it was a fun experience to start from "okay, how are you getting new data?" to end up writing my own connector and dashboard, and I really enjoy these kinds of projects. On this note, thanks for reading, and please don't hesitate to contact me to ask questions or share your opinion!
The code repository for this project is located on git.louis-vallat.dev/louis/tgv-scraper, feel free to take a look!